| Target Basin: | Forecast Initiation Year: | Month: | |
The North American Multi-Model Ensemble (NMME) is a multi-agency effort to combine a suite of global climate models into one real-time operational product. New forecasts are released around the 8th of every month.
Target Basin
Change the Target Basin to view a basin-averaged forecast for each of Colorado's Climate Divisions (defined
by NOAA's National Centers for Environmental Information).
Forecast Initiation
The page immediately loads with the most recent forecast released by the Climate Prediction Center. Archived
forecasts can be accessed back to the initiation of NMME (August 2011). Change the month and the
year and click "GO!" to view an archived forecast.
Model Members
CFSv2 - Climate Forecast System from NOAA's National Centers for Environmental Prediction
CMC1 and CMC2 - Environment and Climate Change Canada's Canadian Centre for Climate Modelling and Analysis
GFDL and GFDL_FLOR - NOAA's Geophysical Fluid Dynamics Laboratory
NASA GEOS-5 - Goddard Earth Observing System from NASA's Global Modeling and Assimilation Office
NCAR_CCSM4 - Community Climate System Model from NCAR's Climate and Global Dynamics Division
The page immediately loads with all of the ensemble members. The user can clear all of the models, check all of the models, or elect to only display one or a subset of models. The graphical display will adjust to only show the models that are selected. Numbers next to the model name represent the number of members for that model.
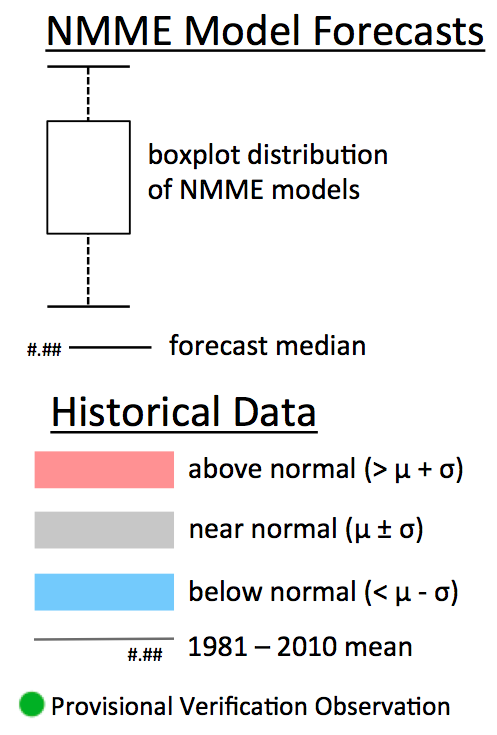
NMME Model Forecasts
The entire ensemble forecast is displayed as a box-and-whisker plot. The box contains the middle
75% range of all the members in the ensemble. Open circles show outliers in the distribution of forecasts.
The forecast median value is displayed to the left of the box-plot
Historical Data
The climatology of a target basin relies on data from NOAA's National Centers for Environmental Information.
The climatology is displayed as color shading, with the gray shading representing the normal
range of values in the 1895 - 2015 time period. The red shading goes up to the highest value for the
period of record, and the blue shading goes down to the lowest value for the period of record.
The dark grey line represents the 1981 - 2010 climatological average for that division (with the value displayed on the right). This value does not necessarily align with the middle of the historic climatology because it is only a recent 30 year average, instead of a period of record (1895-2015) average.
Verification Observations
If you are viewing an archived forecast, you may see green dots on the graph. These green dots
are for months that have already passed and an official observation value has been received
from NOAA's National Centers for Environmental Information. Verification observations allow
a user to assess how a previous forecast performed.
Anomaly Forecast Maps
Below each graph is a link to anomaly forecast maps (one for temperature and one for precipitation).
Six maps (one for each forecast month) allow a user to view the NMME forecasts, spatially across the region. Climate divisions
are outlined in black, and the user can mouseover the individual models to change the map display.
Acknowledgments
The graphical display interface was developed by Joeseph Smith from the Great Lakes Environmental
Research Laboratory.